
Instagram remains a dominant force in social media, with over 2 billion monthly active users and evolving engagement trends. For marketers, understanding the latest demographics, engagement metrics, and advertising statistics is crucial for optimizing return on investment (ROI) and tracking key performance indicators (KPIs). Here’s how to leverage Instagram’s 2025 data to drive better marketing results.
The Instagram User Base: Who’s Engaging?
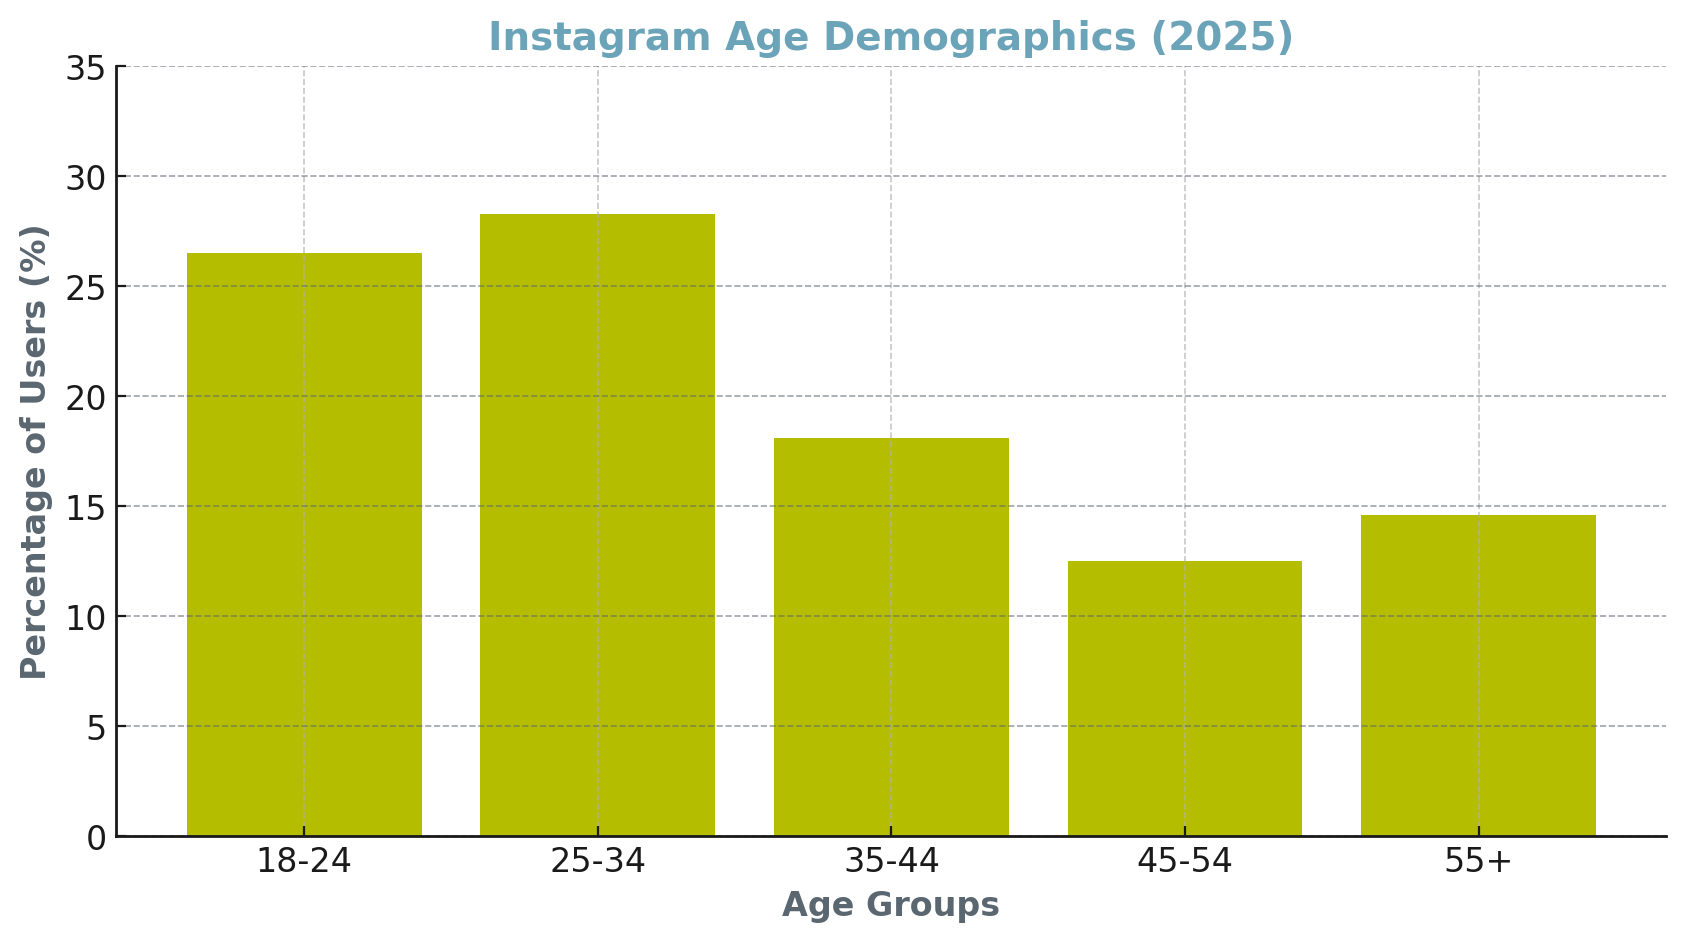
Demographics That Matter for Marketers
- Age Groups:
- 25-34 years old: 28.3% of U.S. users
- 18-24 years old: 26.5% of U.S. users
- Gender Distribution:
- 49.4% female, 50.6% male
- Time Spent on the Platform:
- Users spend an average of 32 minutes per day on Instagram.
(Source: Sprout Social, Statista)
Why This Matters for ROI
- Marketers should allocate ad spend and content strategies based on user age groups and engagement trends.
- Younger audiences (18-34) drive most interactions, making this the prime target for consumer-facing brands.
- The 32-minute daily average highlights Instagram’s continued role in capturing audience attention—strong KPIs should focus on engagement duration and content stickiness.
Engagement Metrics: What Drives the Best Results?
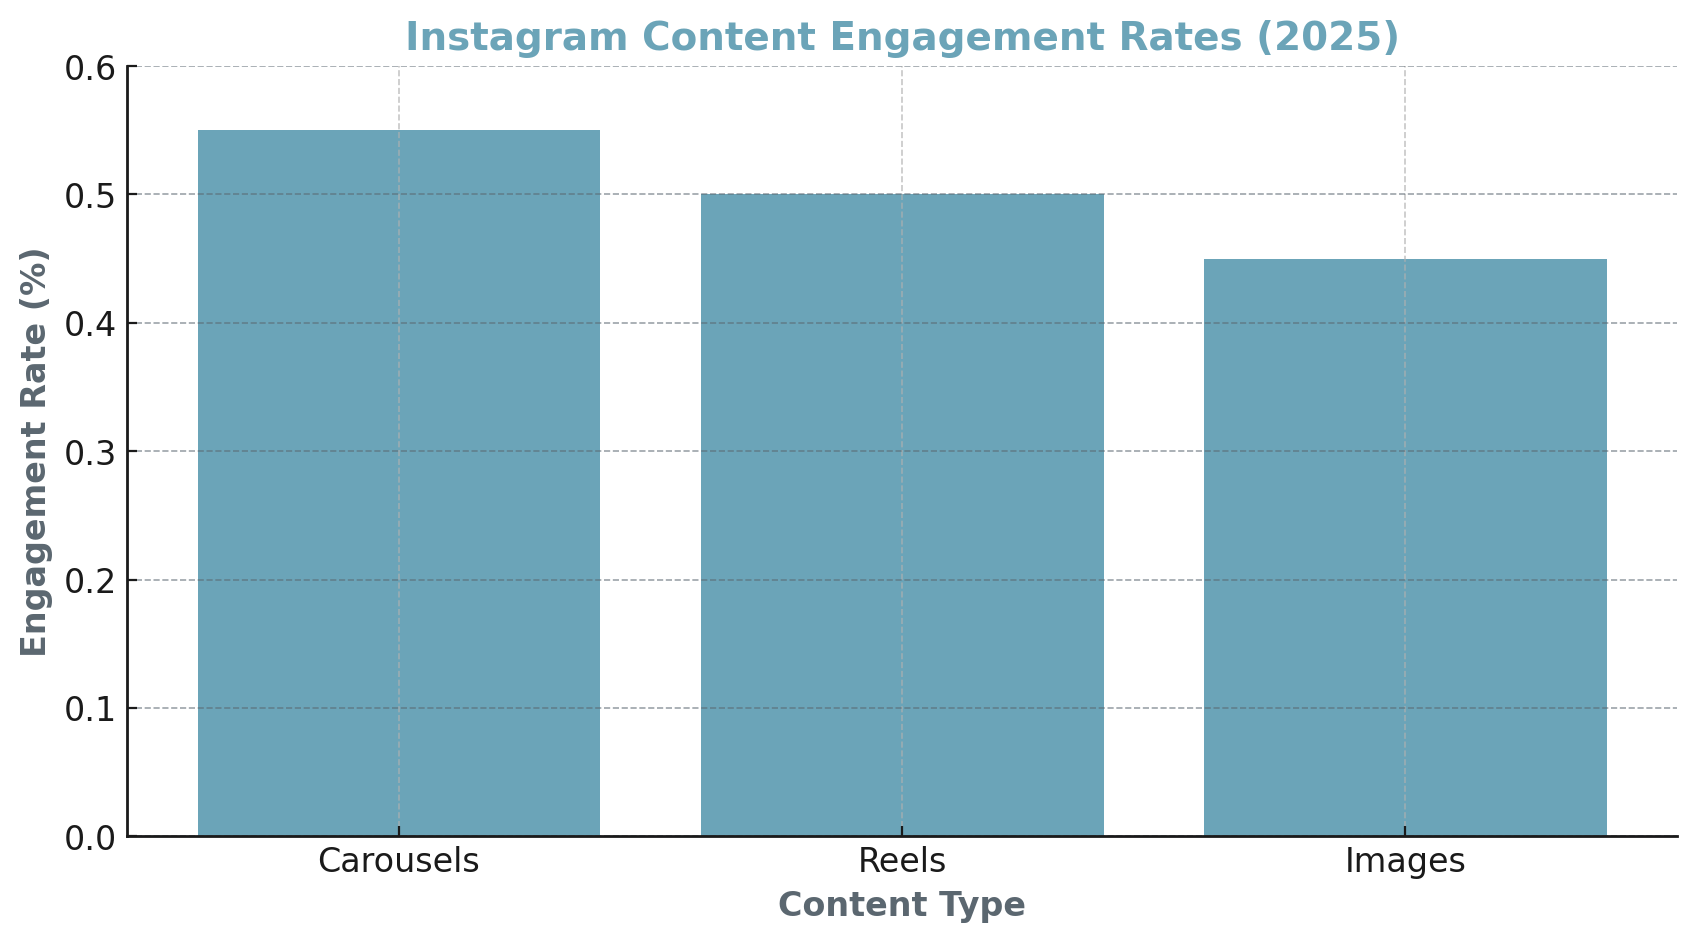
Content Performance Benchmarks
- Carousels: 0.55% engagement rate (leading format despite a 15% YoY decrease)
- Reels: 0.50% engagement rate
- Images: 0.45% engagement rate
(Source: Social Insider)
Maximizing Engagement KPIs
- Prioritize carousels and Reels for organic engagement and ad performance.
- Track CTR (click-through rate) and interaction per post to measure content effectiveness.
- Experiment with short-form video strategies as Reels continue to grow in prominence.
Advertising Performance and Revenue Trends
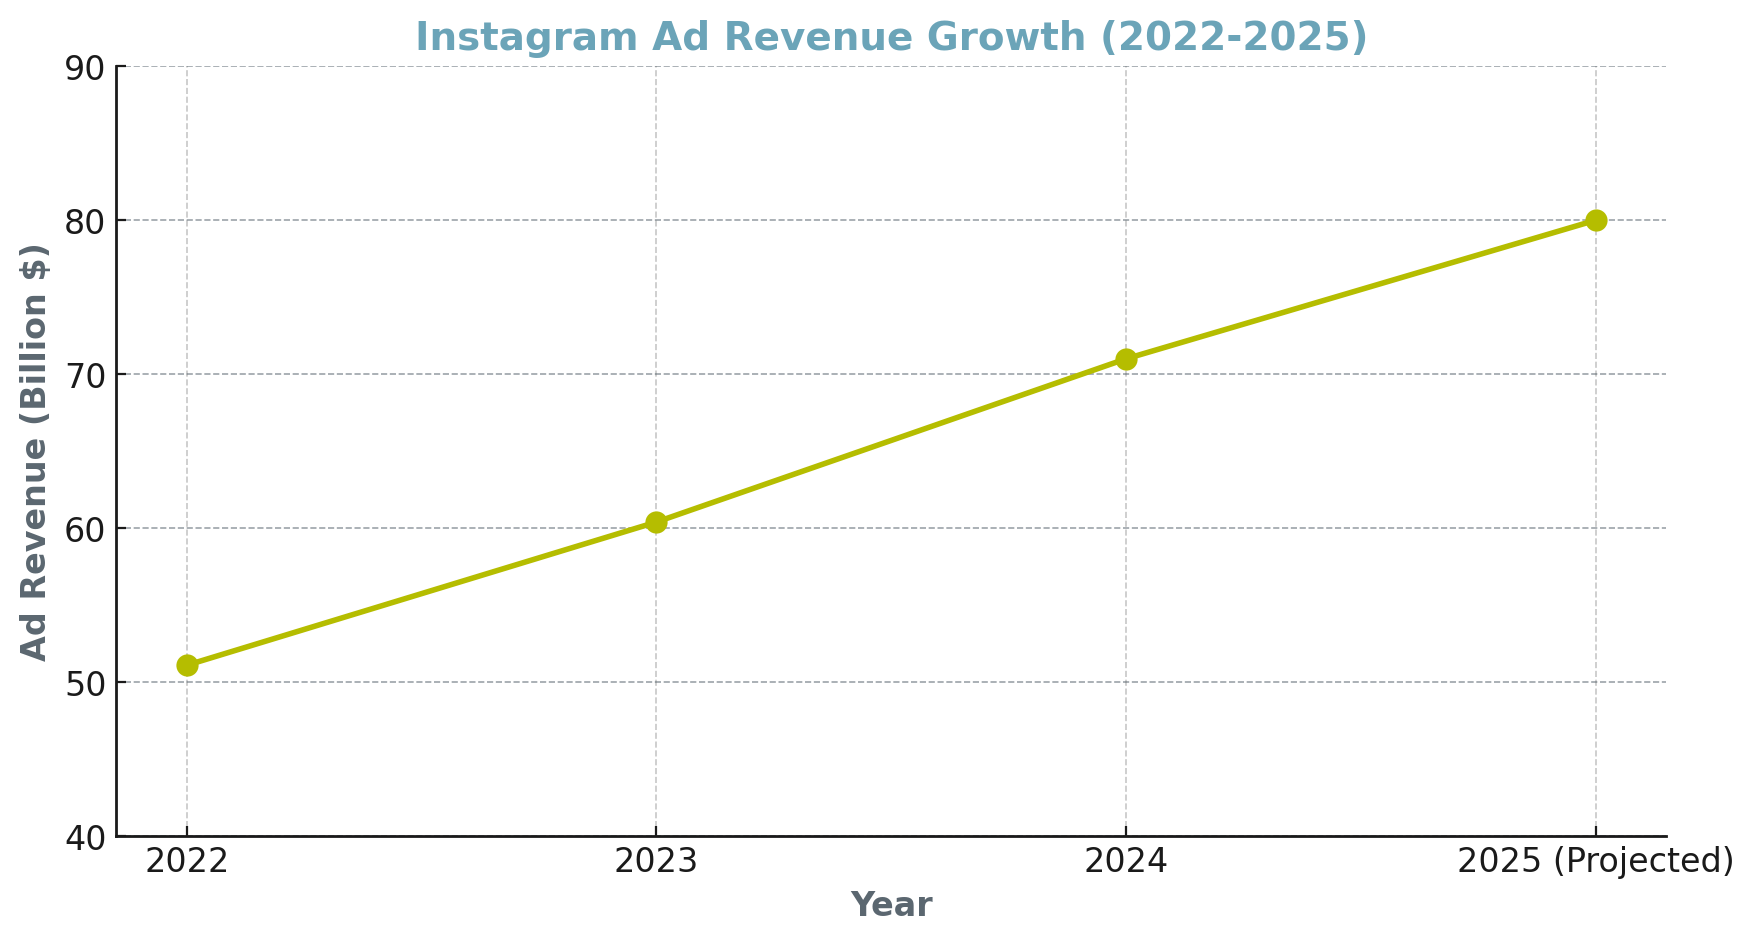
Instagram’s Ad Growth & Market Share
- Instagram is projected to account for over half of Meta’s U.S. advertising revenue in 2025.
- Instagram’s ad revenue is forecasted to reach $71 billion by the end of 2024 (up from $51.1 billion in 2022).
How to Improve Ad ROI
- Allocate higher budgets to Instagram, given its increasing share of Meta’s ad revenue.
- Focus on cost-per-click (CPC), conversion rates, and cost-per-acquisition (CPA) to measure ad efficiency.
- Use AI-powered targeting tools to improve audience segmentation and ad relevancy.
Instagram Shopping & Consumer Behavior
Commerce on Instagram
- 29% of Instagram users make direct purchases on the platform.
- Instagram ranks as the third-most-used social media platform for shopping.
(Source: Sprout Social)
Boosting E-commerce KPIs
- Leverage Instagram Shopping & Checkout features to shorten the sales funnel.
- Track conversion rates and cart abandonment rates from Instagram sales integrations.
- Implement retargeting ads to increase repeat purchases and maximize ROI.
Global Reach and Market Expansion
Top Countries Using Instagram
- India: 362.9 million users
- United States: 169.65 million users
(Source: Statista)
Scaling Global Campaigns
- Localize content and ad strategies for high-user markets like India and the U.S.
- Monitor regional engagement rates and CPC variations to optimize ad spend.
Final Thoughts: Turning Instagram’s 2025 Data into Actionable Strategy
Instagram remains a powerful marketing channel, but success depends on leveraging real data to drive ROI and track KPIs effectively. By focusing on high-performing content types, optimizing ad spend, and utilizing shopping features, marketers can ensure they are maximizing their presence on the platform.
Key Takeaways for 2025:
- Use data-backed insights to refine targeting and campaign performance.
- Optimize content mix by prioritizing carousels and Reels for engagement.
- Track conversion-driven KPIs (CPC, CTR, ROAS) to measure Instagram ad success.
- Capitalize on shopping trends by integrating Instagram commerce into e-commerce strategies.
Are you making the most of Instagram’s marketing potential in 2025? Now is the time to refine your strategy and stay ahead in the evolving digital landscape.